Working with Table Reports
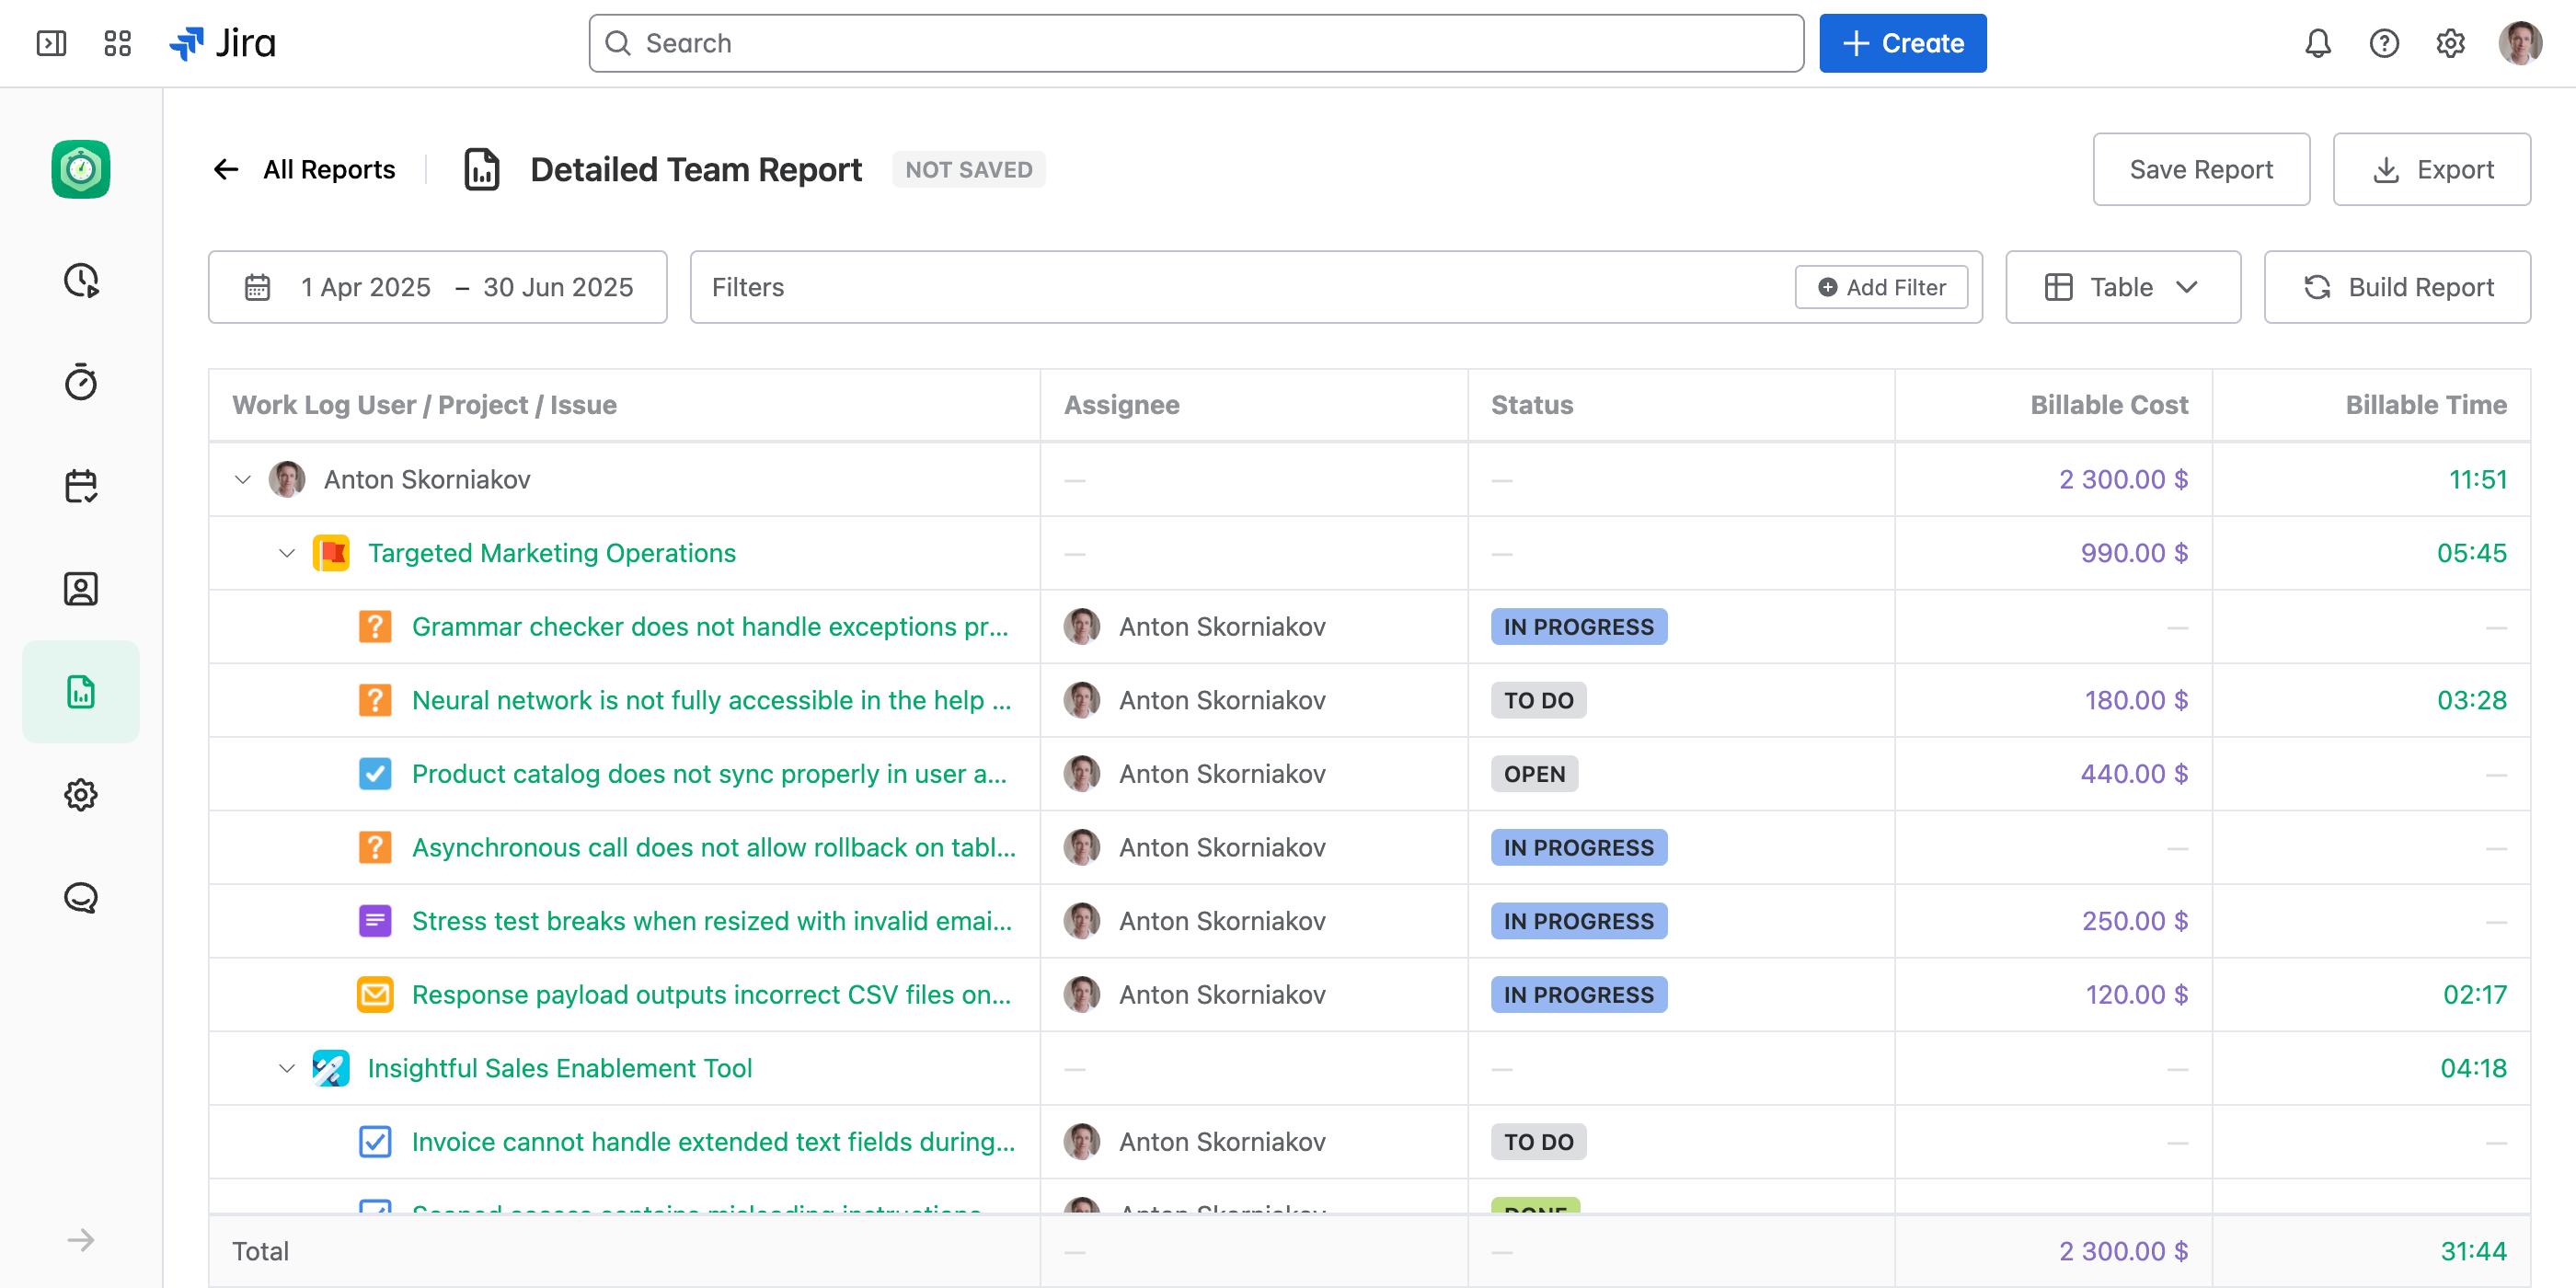
Table Reports in JetTime provide a comprehensive way to view and analyze tracked data such as time, costs, and custom metrics. The tabular structure ensures data is organized for easy analysis, monitoring, and reporting across teams, projects, and accounts.
Key Features of Table Reports
JetTime’s Table Reports offer a powerful and customizable way to present data. Key features include:
- Custom Columns: Add or remove columns to display relevant data, such as projects, accounts, assignees, or custom fields.
- Grouping and Expandability: Organize your data by grouping rows hierarchically (e.g., by project, account, issue, custom fields, etc) and expand those groups to drill down into detailed data.
- Total Summaries: Display calculated totals for time, financial data, and other custom metrics for easy review and analysis.
- Date Range Inclusion: Set a date range to include relevant work logs and data in your report, ensuring accurate and time-bound insights.
- Advanced Filtering: Apply dynamic filters to narrow down the visible data, such as filtering by projects, users, accounts, or custom fields.
When to Use Table Reports
Table Reports are particularly suitable for scenarios that require a detailed, data-focused view. Use cases include:
- Reviewing time tracking data for specific accounts, teams, or projects.
- Examining team or individual performance using grouped and detailed data.
- Conducting financial analyses, such as tracking project costs and billable hours.
Next Steps
Explore other reporting features, such as customizing reports or exporting data to Excel or PDF, to maximize your insights and productivity.