
Working with Worksheet Reports
View time, financial, and custom metrics broken down by day, week, month, or quarter.
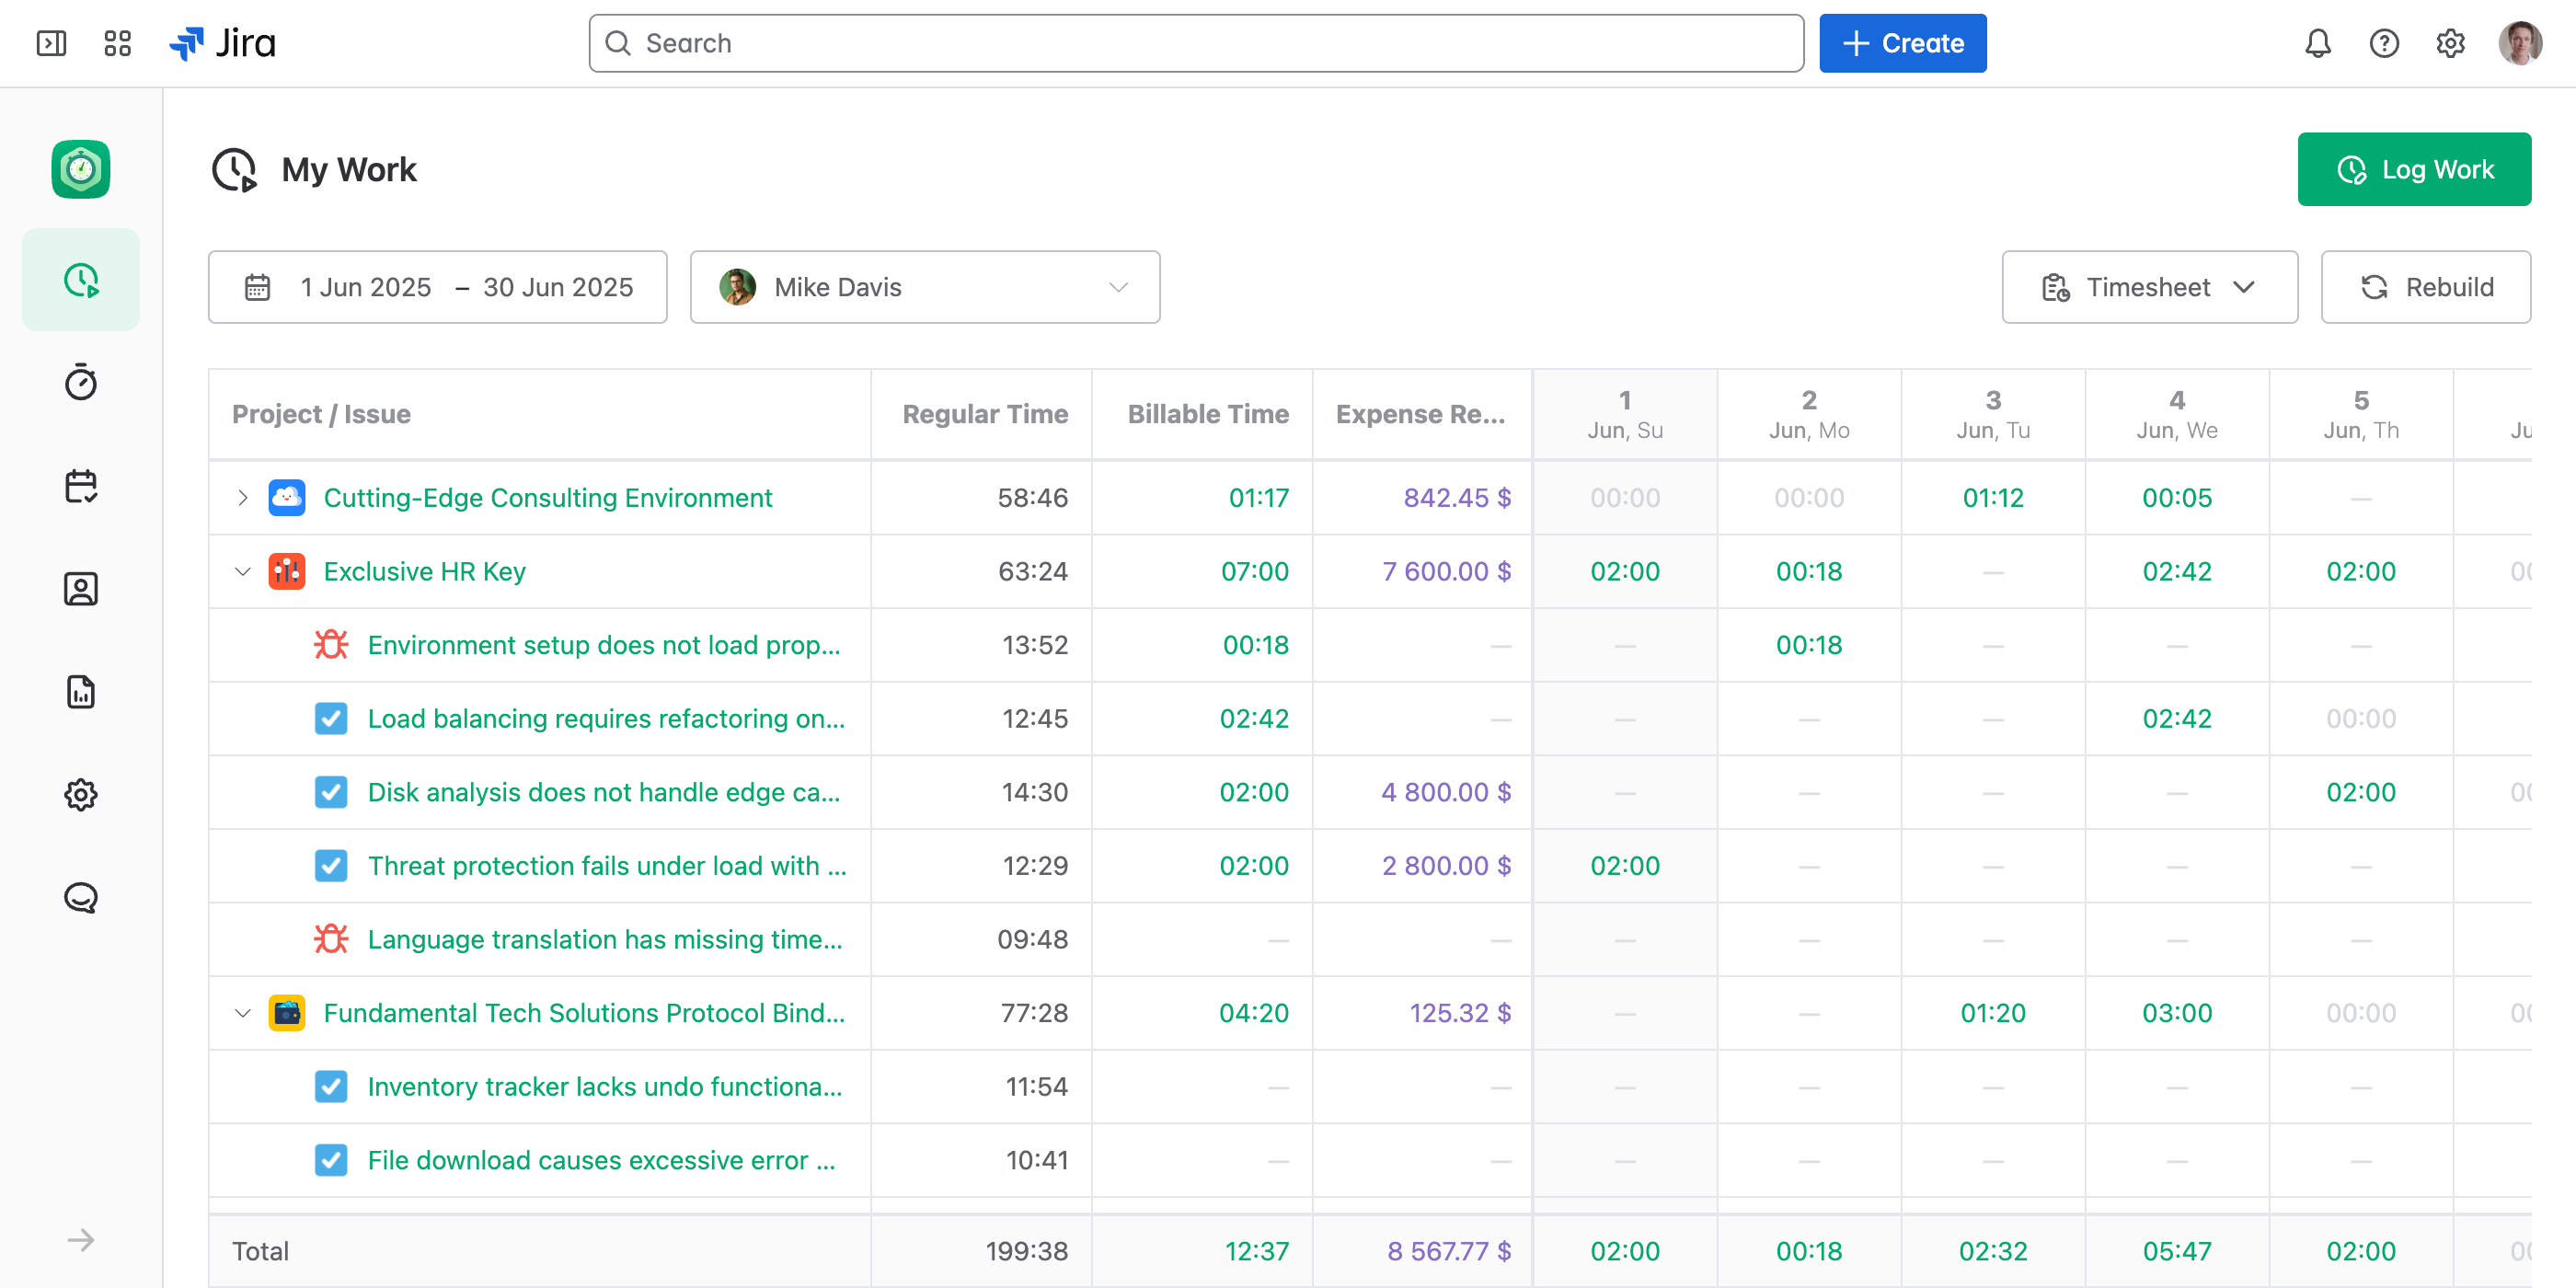
Worksheet Reports in JetTime provide a user-friendly view to analyze tracked data over specific time periods, including time, financial data, and custom metrics. The Worksheet is what other tools call a timesheet, but broader: it sums any metric you track, not just hours. This flexible reporting mode lets you review your data in breakdowns such as daily, weekly, monthly, or quarterly views and interact directly with work logs for each cell.
Supported Worksheet Breakdowns
JetTime's Worksheet Reports allow you to view data with the following breakdown options:
- Daily: Breaks down data by individual days for detailed tracking.
- Weekly: Groups data by weeks, providing an overview of weekly progress.
- Monthly: Groups data by months for monthly reporting.
- Quarterly: Summarizes data for each quarter (Q1, Q2, etc.) — ideal for high-level reviews.
You can adjust the desired breakdown in your report settings to match your analysis needs.
Viewing Work Logs in Worksheets
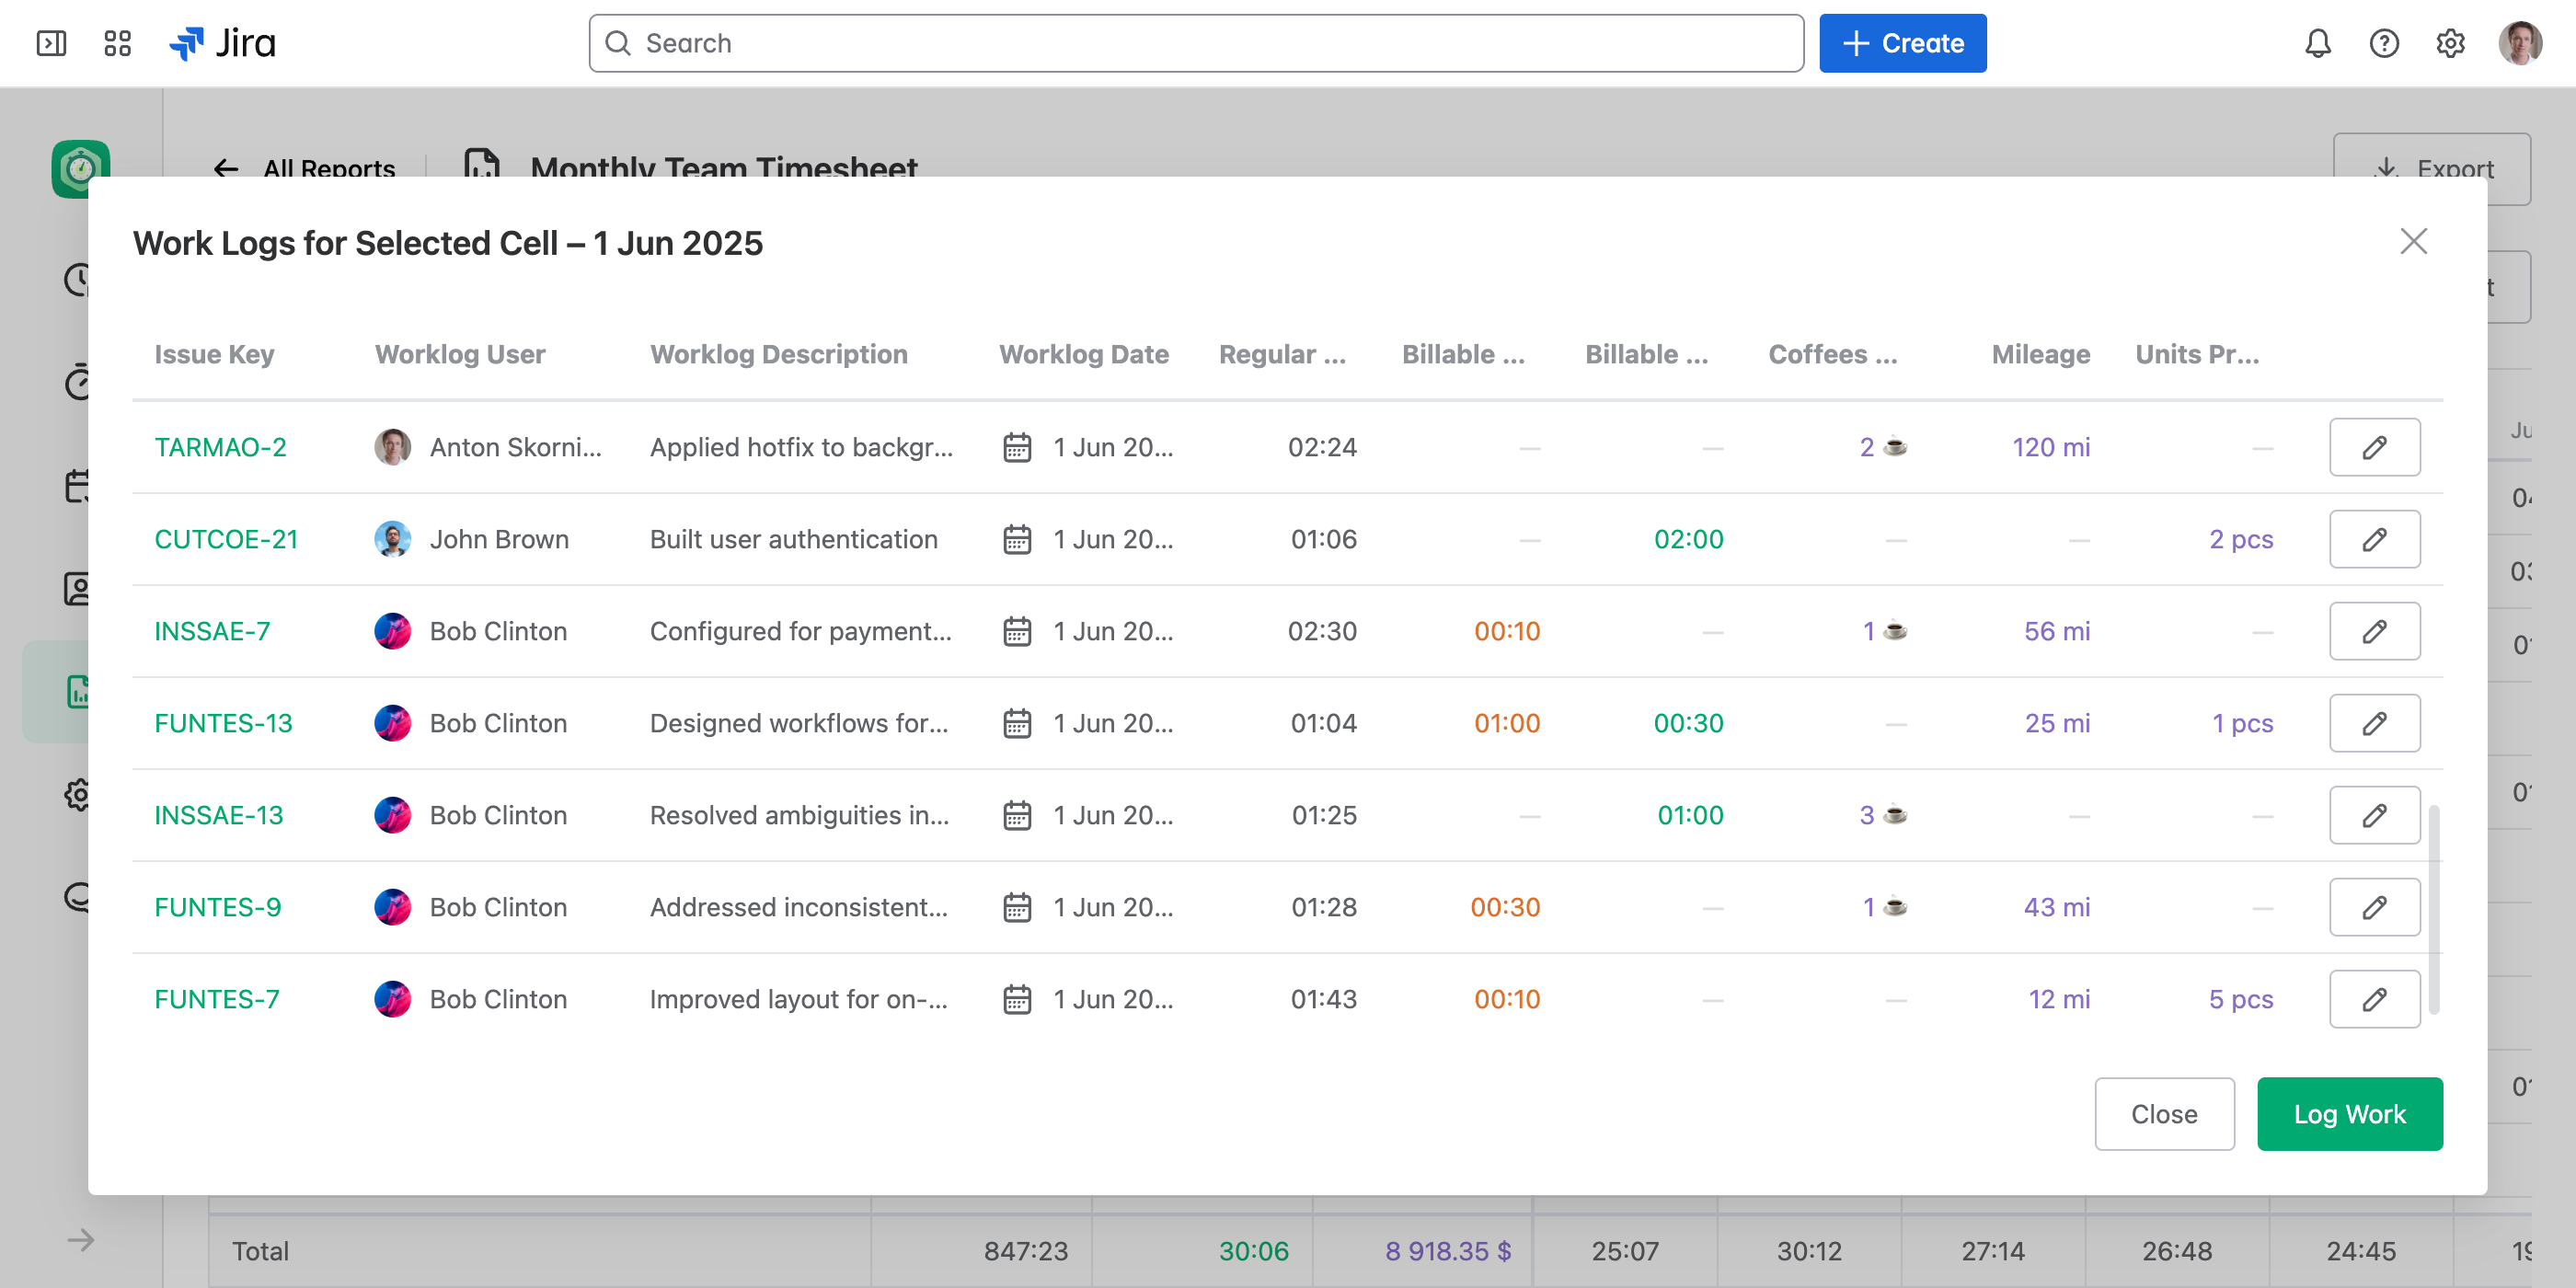
Each cell in the Worksheet represents a summary of the data for a specific time period (e.g., hours worked, costs, or other custom metrics). By clicking on a cell, you can view a detailed list of the work logs contributing to that specific timeframe, giving you granular insight into the data.
Financial and Custom Metric Worksheets
Worksheets support not only traditional time tracking but also extend to:
- Financial Worksheets: Allow you to track and summarize project costs and other custom financial data by time period.
- Custom Metric Worksheets: You can define custom numeric metrics (e.g., mileage, items shipped, etc) and review their breakdown in the Worksheet mode.
Customization Options
Worksheet Reports are highly customizable, enabling you to tailor the output to your specific needs:
- Select how the data is broken down (day, week, month, or quarter).
- Choose the metric data to display in the worksheet (time, financial data, or custom-defined metrics).
- Adjust columns, grouping, and filters to refine the report view.
Next Steps
Explore more about Worksheet Reports by learning how to configure and customize them, or dive deeper into reporting on financial data and custom metrics.